Surveying on Sensitive Topics: Implicit Association Test
Measuring attitudes towards certain groups of individuals or behaviours may be of interest for a multitude of reasons. It may be of direct interest in order to understand how a society behaves (Efferson et al., 2015), in order to understand if an intervention is able to change these attitudes (Vogt et al., 2016) or to understand how variation in attitudes results in different impacts of an intervention (Croke, Goldstein, & Holla, 2017). Asking people directly about their attitudes towards a behaviour or group of people may not accurately capture their attitudes as they alter their responses to be in line with what they think the person asking them would like to hear. In addition, people may have biases they may not even be aware of when asked directly: that is an ‘implicit bias’.
An innovative way to measure people’s attitudes used in psychology in developed countries are implicit association tests (IATs). These are now being used in settings with low literacy by psychologists but have also been picked by economists in the last few years. There are some concerns about the reliability of the method (see here for details) so these tests should be used with caution. The use of IATs also does not preclude the use of explicit questions about it which may provide an insight into how the respondent ‘actively thinks about it’ (Gawronski & Bodenhausen, 2006)
IATs work by assessing the relative strength of associations between pairs. These can be pairs of concepts or attributes that are of interest to the researcher. Image and/or words (or audio recordings in local language if there are concerns about literacy level) are displayed on a screen and the respondent has to press a key as quickly as possible to indicate whether it belongs to either side of the screen, where each side denotes something ‘good’ or ‘bad’. The basic assumption is that response times will be quicker for associations that are stronger. Hence relative implicit attitudes towards the concepts in terms of the attributes are revealed. Steps taken:
- Measure the response time taken for each correct click.
- Compute the average response time for each round.
- Compare this average across the two rounds by computing the d score. The d score (Greenwald et al., 1998) is equal to the difference between the average response time taken in each of the rounds divided by the overall standard deviation. Respondents with neutral associations are expected to have a score around 0.
In Mahmud, Orkin & Riley (2019), we used IATs to measure attitude towards intimate partner violence. OpenSesame, an open-source platform used primarily for programming psychology experiments, was used. Since the rest of the survey was coded in ODK, IAT administration required the respondent identification number to be entered again and for the data from IAT to be merged later with the rest of the survey. We provide some details and resources on how to code an IAT such as this in the development and administration tips below.
The IAT was designed following the approach of Efferson et al., 2015. The entire test includes six rounds (outlined in table below) - four practice rounds (1.1 - 1.3) and two actual rounds (2.1-2.3). Before each round, individuals were instructed to place words into a specific category by clicking the button on the appropriate side of the screen. For instance, if in a round they are instructed to place all words pertaining to domestic abuse into the category `bad', they are supposed to click the button close to the `sad' face whenever they hear such words and click the button close to the happy face otherwise. Individuals are given two chances to correct a mistake and are asked to contact the enumerator for assistance the third time. In the practice rounds, the respondents categorise words describing happy feelings, sad feelings and names of reptiles in a similar manner. The order in which individuals are asked to associate domestic abuse-related words with `good' or `bad' categories is randomised to prevent learning effects from affecting the results.
Table 1 - Round wise details in the Implicit Association Test
| Round | Type | Number of Words |
| Round 1.1 | GOOD, BAD | 10 |
| Round 1.2 or 1.3 (randomised) | GOOD+REPTILES, BAD | 15 |
| Round 1.2 or 1.3 (randomised) | GOOD, BAD + REPTILES | 15 |
| Round 2.1 | GOOD, BAD | 10 |
| Round 2.2 or 2.3 (randomised) | GOOD + DOMESTIC ABUSE, BAD | 15 |
| Round 2.2 or 2.3 (randomised) | GOOD, BAD + DOMESTIC ABUSE | 15 |
We measure the response time taken for each correct click, compute the average response time for each round and then compare this across the two rounds. The average response time taken in the round where domestic abuse is associated with the bad category is subtracted from the average response time taken in the round where it is associated with the good category. This difference is then divided by the standard deviation of all the response times pertaining to these two rounds to obtain the d score. The higher the score, the slower (relatively speaking) the individual is at placing words associated with domestic abuse into the good category, suggesting that they have more negative attitudes towards domestic abuse.
As mentioned earlier, Mahmud, Orkin & Riley (2019) coded the IAT in their survey using Open Sesame. It is user friendly and most of the programming can be done by using the provided widgets. These widgets include, for example, (a) the “sketchpad” which is used to create the display screen as it will appear for the respondent. This can include images and sound files and can be used to collect responses. (b) a “touch item” or “keyboard item” which indicates that the response will be touch/keyboard based. This also contains information about which part of the screen corresponds to which outcome, (c) a “loop” which can be used to collect different questions together, indicate the order in which they’re asked, and how many times they need to be asked and (d) a “logger” that collects the responses and stores the response times. It can also include participants being able to hear a question again if they didn’t hear it the first time or ask them to contact the surveyor if they have mistakenly entered the incorrect response in a practice round multiple times. This web article provides an illustration of coding an IAT on Open Sesame.
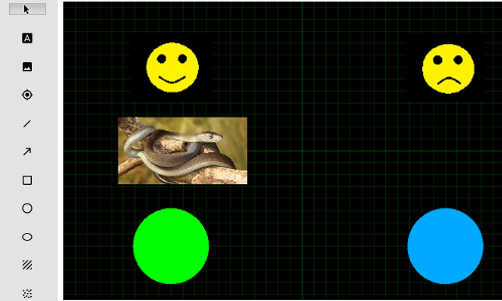
An example of the Open Sesame sketchpad from Round 1.2 of the Mahmud, Orkin & Riley (2019) IAT is shown above. This is the case where the correct response for a “reptile” stimulus is ”good” i.e. the left side of the screen is the correct response. The display can be edited by using the various options on the side and a sound item for instructions can also be played in the beginning of the round. The sketchpad is divided into a fixed number of rows and columns specified by the touch item. Each cell corresponds to a participant response and the correct answer can be pre-specified as well. For example, in this case, the sketchpad display can be divided into 2 columns and 1 row since there are 2 possible responses and the correct response is 1. Instead of making manual changes, the user can also edit the script which generates each of these different items.
Greenwald (2003) discuss different approaches to compute the IAT d score and introduce a new algorithm which is a refinement of the procedure they suggested in Greenwald (1998). For example, how should we treat unusually fast and slow response times? As per the algorithm suggested in Greenwald (2003), we should (a) remove respondents whose response times are less than 300 milliseconds for more than 10 percent of their responses and (b) remove the responses for which respondents take more than 10,000 milliseconds to answer. We can compare this measure with the raw measure (keeping all the outliers) and with the measure obtained after winsorizing the response times. It is useful to see how the distribution of the computed d-score changes for these different approaches. In the case of Mahmud, Orkin & Riley (2019), the distributions were not very different and majority of the participants did not exhibit implicit attitudes legitimising domestic violence.
The supplementary material to Effeerson et al., 2015 and the online appendix to Lowess et al (2015) also provide really good detailed step by step information on implementing it in a LMIC setting with low literacy levels. It is important to do careful qualitative work and pilot the test. Some things to consider:
- Use two neutral colours for the left/right buttons.
- Find culturally relevant images or names for locally recognisable versions for each chosen category.
- Find culturally relevant images or words that encapsulate the concept of the outcome you are interested in such as intimate partner violence.
- Find suitable positive and negative words in the local language and consider carefully if these are to be recorded in male or female voices if audio clips are to bemused.
- In the practice rounds, two second chances are allowed after consecutive incorrect categorizations. Then the respondent is asked to consult the surveyor and is given a third chance after that.